AI Infographic Generator
CGTrader’s ai infographic generator is a modern tool designed to empower users in creating compelling visual representations of data and ideas. CGTrader provides an intuitive way to generate striking images that combine data visualization with creative design. It uses state-of-the-art image models, namely FLUX.2 Pro and Nano Banana, to ensure that the output is not only visually appealing but also reflects the underlying data and narrative accurately. Whether you need to convert raw data into an eye-catching infographic or simply visualize a complex concept, CGTrader is engineered to offer a seamless experience.
By automating much of the design process, CGTrader eliminates the need for extensive manual design work, enabling users to focus on refining their message rather than struggling with layout and aesthetics. CGTrader is particularly useful for professionals, educators, and marketers who need to communicate complex ideas clearly and effectively. Moreover, its user-friendly interface ensures that even those with minimal design experience can produce high-quality graphics.
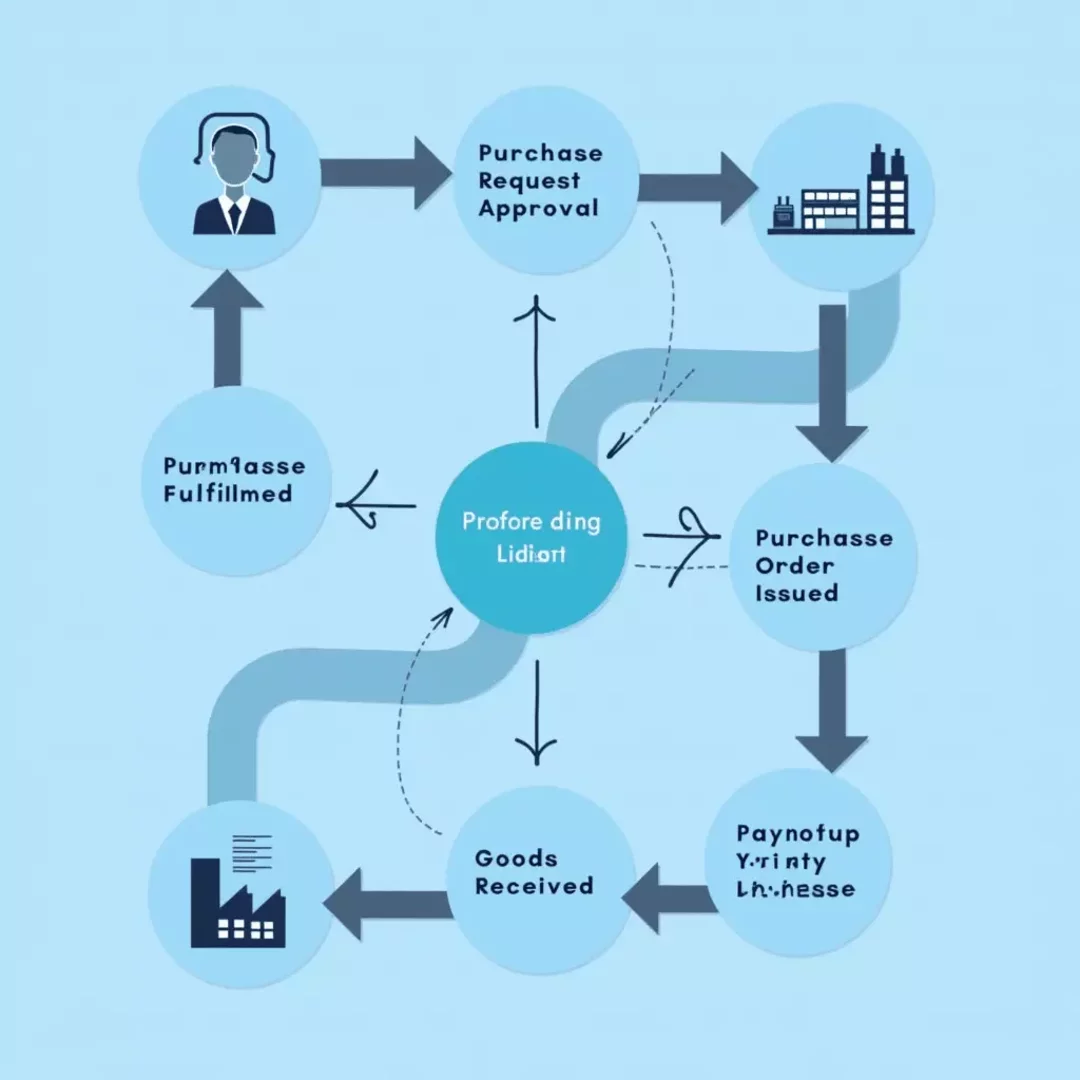
Generate Infographics from text in seconds
CGTrader's AI Infographic Generator employs a sophisticated workflow to convert your ideas from text and numerical inputs into vibrant visuals. The process begins with a transformer-based model that meticulously analyzes the user-provided text and data. This model extracts key themes, trends, and focal points, ensuring that the core message of your content is not lost in translation. By understanding the narrative, the system is able to prioritize the most significant elements, ensuring that every piece of information is accurately represented in the final output.
Following this initial analysis, a pre-trained convolutional neural network (CNN) takes over. This network is responsible for generating and arranging visual elements such as charts, icons, and captions into a cohesive design. The CNN understands design principles and aesthetics, ensuring that the final infographic is not only informative but also visually balanced. The combination of these two powerful AI models enables the tool to create visuals that are both data-rich and appealing to the eye. How to use it:
- If needed, upload a reference image, it will be used as a base reference for the image generation
- Write a text prompt, which will guide the generation (and will change the uploaded image according to the prompt if one selects such an option)
- Add a reference image to further guide the details and style of your images
- Select the corresponding Aspect Ratio and number of Variations
- Use additional AI tools from CGTrader AI, like applying the style of another image, combining several reference images, or editing the result with a text instruction
- Press generate and watch how your uploaded image is transformed into a professional, high-quality infographic
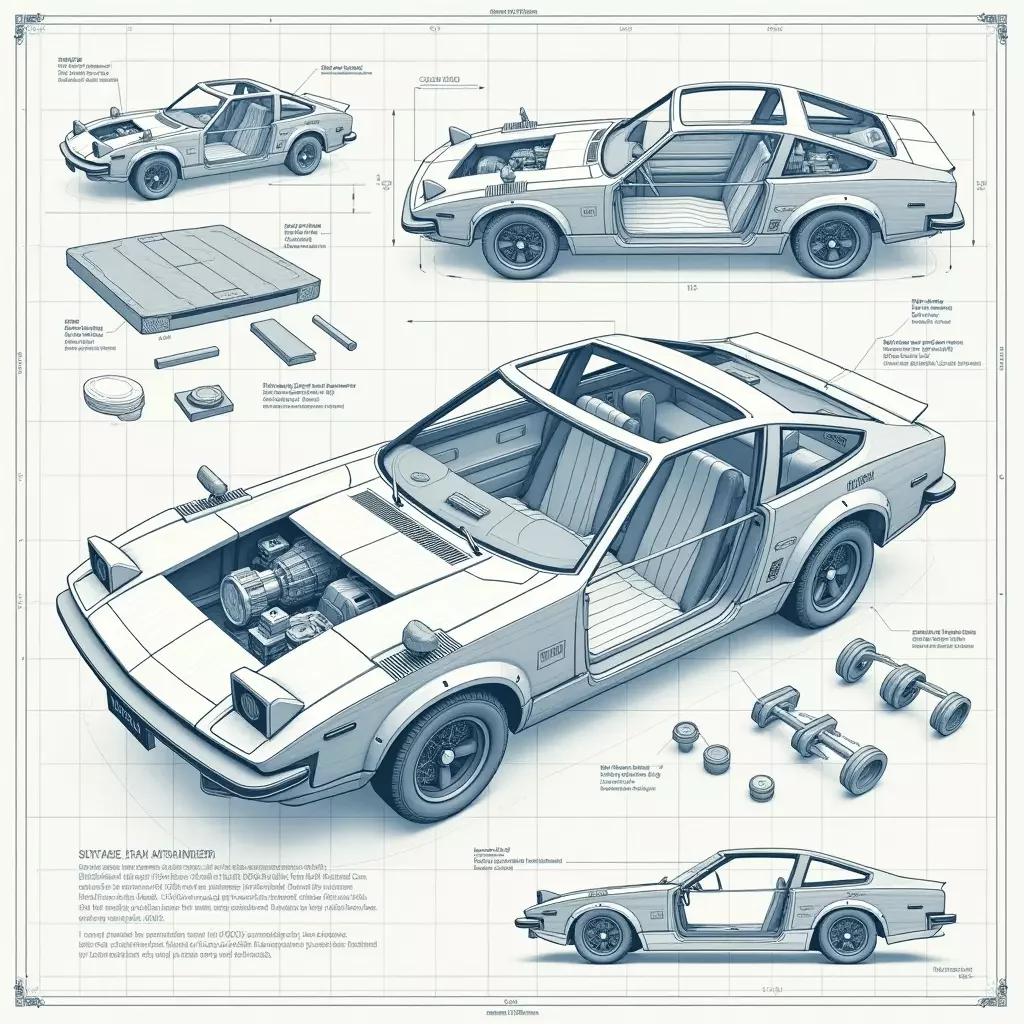
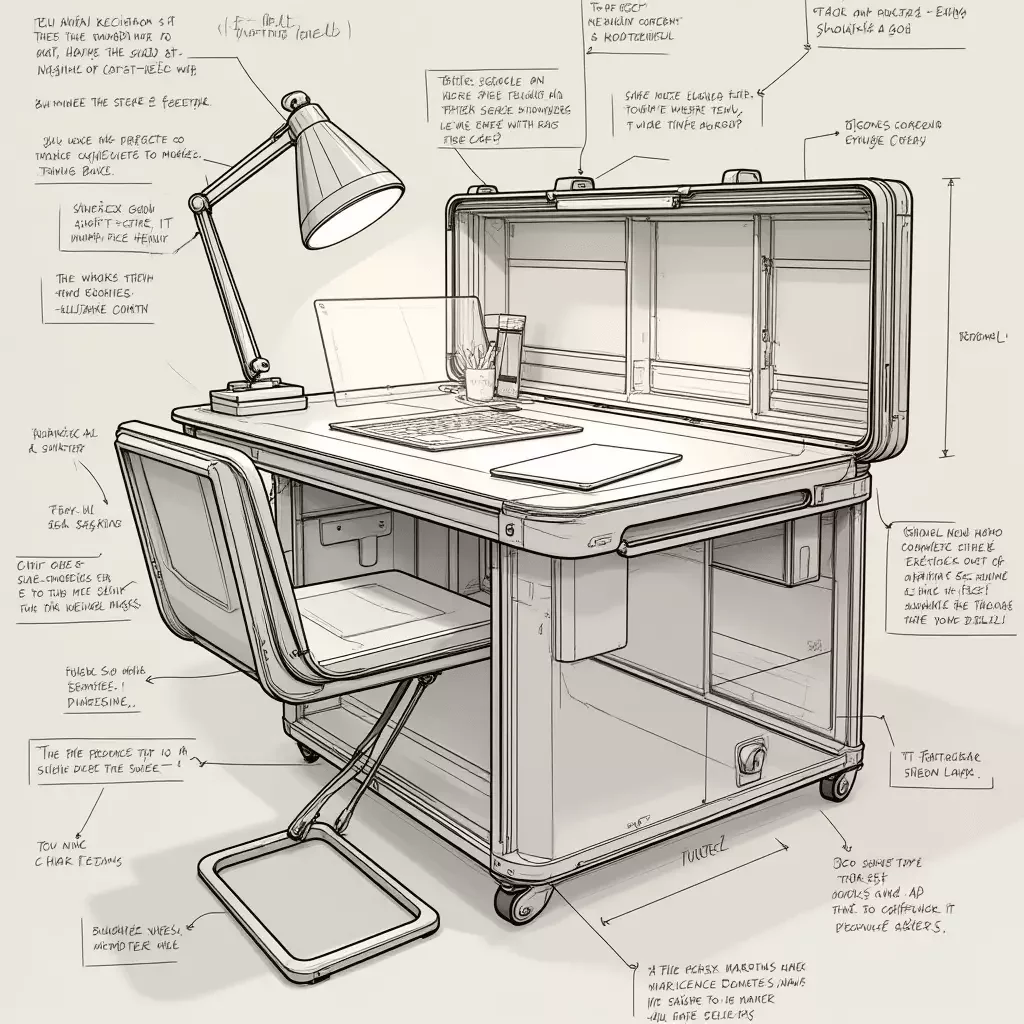
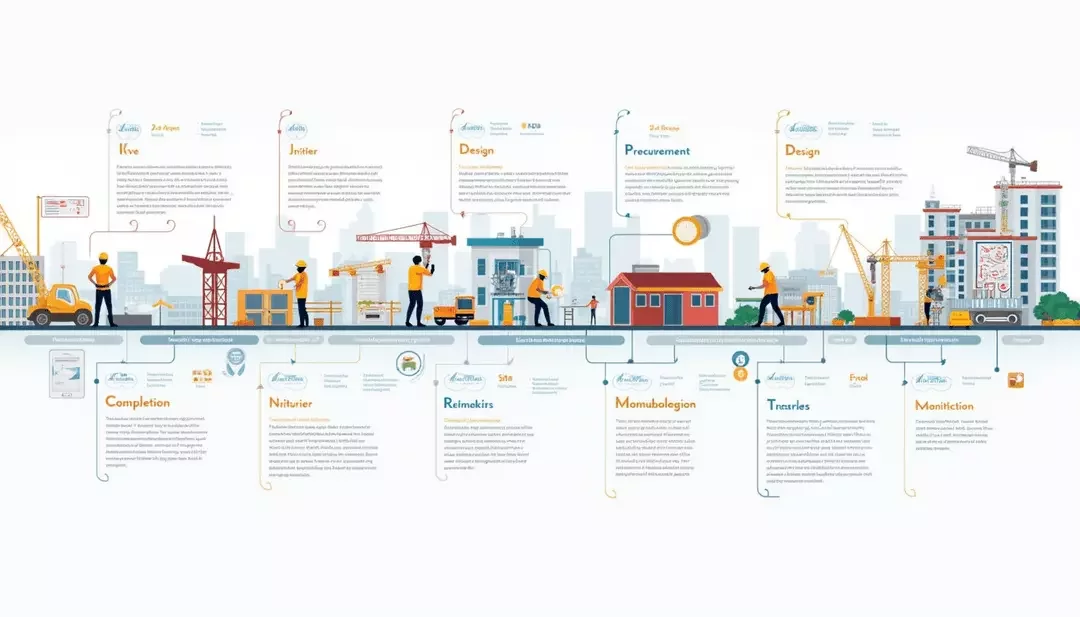
Frequently Asked Questions
Creating an infographic using CGTrader’s tool is a straightforward process. Start by inputting your data and text into the system, and let the model analyze your content. This investigation helps identify key trends and themes which the convolutional neural network then translates into visual components. The result is a cohesive graphic that accurately reflects your data and narrative, transforming abstract ideas into tangible visuals that engage and inform.