16 Apr 2018
Tips & Insights
News
We’re happy to announce the revamp of the seller’s dashboard, which boasts a new interface, easier access to information and better overall usability. Read on to find out what’s new.
The dashboard has become a lot more visual and interactive, with most elements (graphs, numbers and tooltips) giving you additional information as you hover your mouse over them. Most of these elements are also clickable and will allow you to access more detailed information.

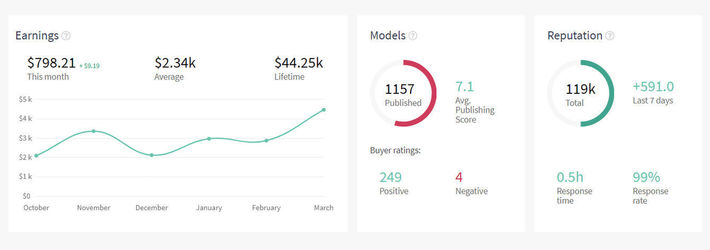
The Earnings tab is on the top left of the dashboard and shows you your earnings after royalties. The number next ‘this month’ shows you your latest sale, you can click it to quickly access data on all of your sales. Hover over the graph to see how much you’ve earned each month.
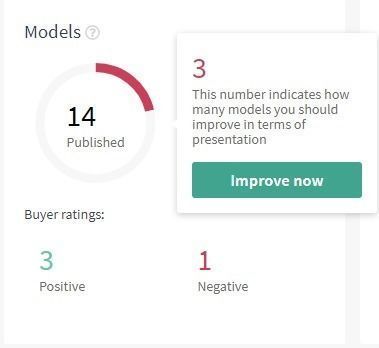
The top Models tab has two diagrams, which show you the total number of models you have published and those that need improvement. Hover or click the diagram to go to the Models improvement section of your profile. There, you’ll find everything you need to do to improve the presentation and ranking of your models.
The average publishing score aggregates scores of all models in your portfolio. The better you publishing score is, the higher you rank in our search and in Google searches. You can increase this score by improving your model descriptions, adding more preview images, file formats, and model tags.
You will also see buyer ratings which can be viewed on your public profile.

How’s your reputation? Hover over the diagram to find out your royalty rate and how many points you need to get to the next level or click ‘Learn more’ so get more details on levels. This tab also shows how fast and how often you respond to private messages – keep in mind that customers want great service and take these numbers seriously.
Trending models – you will be able to see the top performing models and trending designers. You can click on the name of any model or designer in the table to go to its page. Learn from the best!
CGTrader news – feature announcements (like this one), interviews, inspirational posts and insights into the market. Click any title, image or category to quickly access its page.

Jobs – quick overview of the newest freelance 3D job postings and information about your ongoing works. You can select the job filter, visit the page of a job or apply to jobs straight from the dashboard.
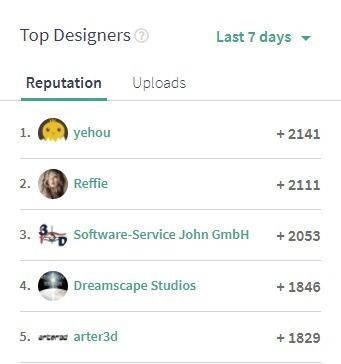
Top designers – our renewed and enhanced ranking board! Use the table filters to see the top performing designers of the week or month in terms of reputation and number of uploads. You can click a username to visit its page.
Analytics – a snippet of our massive Analytics tool. Hover on the models, avg. price or sales columns to get additional information on any keyword. Click the CGTrader or Google icons to open searches for the keyword. Clicking ‘Show more’ will open the Analytics page. You can read more about Analytics here.
We make these changes to improve your experience. Please tell us what you think about the new dashboard by leaving your comments, suggestions or complaints under this post.


Comments